Approximating Copulas
This page demonstrates how to approximate and visualize copulas using the copul package through simple examples and visualizations.
pip install copul
>>> import copul as cp
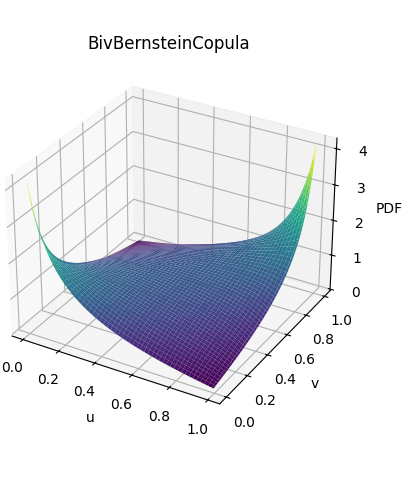
Bernstein Copula Approximation
We approximate a Gaussian copula using Bernstein copulas of sizes \(3 \times 3\) and \(20 \times 20\).
gauss = cp.Gaussian(0.5)
gauss.plot_pdf()
gauss.to_bernstein(3).plot_pdf()
gauss.to_bernstein(20).plot_pdf()


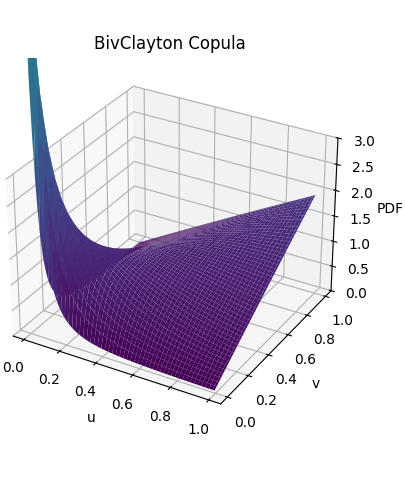
Checkerboard Copula Approximation
Approximate a Clayton copula using a \(5 \times 5\) checkerboard copula.
clayton = cp.Clayton(1)
clayton.plot_pdf(zlim=(0, 3))
clayton.to_checkerboard(5).plot_pdf()

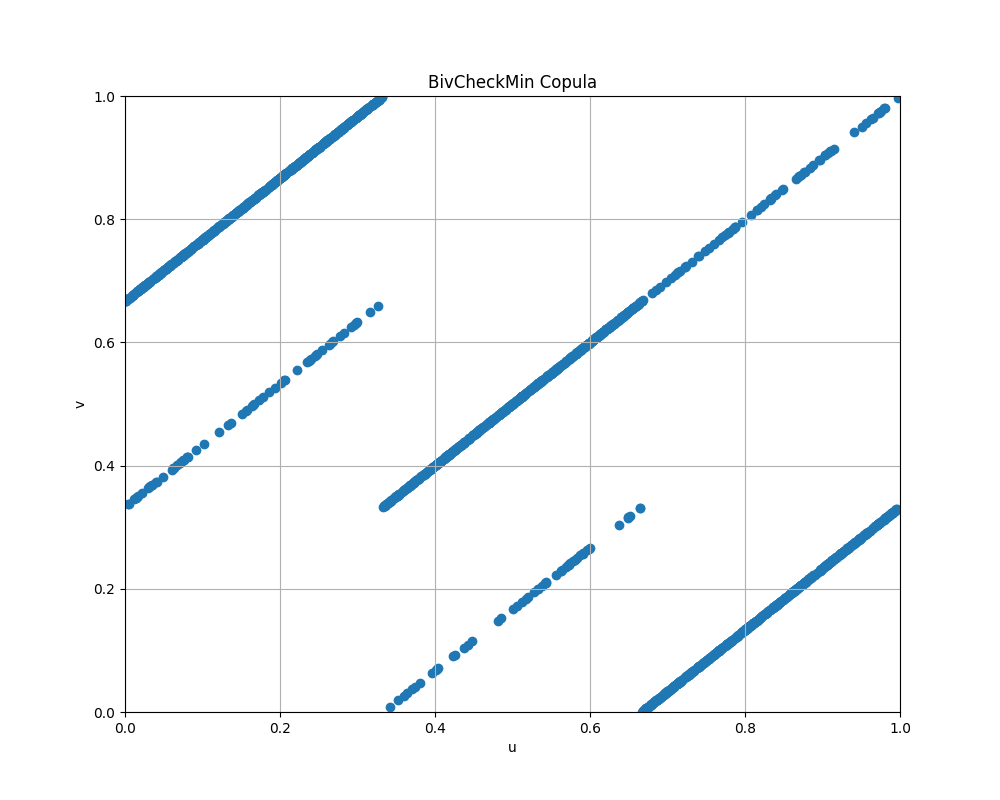
Check–Min vs Checkerboard
Compare scatter plots of samples from a check–min copula and a checkerboard copula constructed from the same matrix.
matr = [[0, 1, 9], [1, 9, 0], [9, 0, 1]]
cp.BivCheckPi(matr).scatter_plot(2_000)
cp.BivCheckMin(matr).scatter_plot(2_000)

Estimation of Chatterjee’s xi
Estimate Chatterjee’s xi using checkerboard and check–min approximations for the Ali-Mikhail-Haq copula with parameter 0.8.
import matplotlib.pyplot as plt

amh = cp.AliMikhailHaq(0.8)
grid_sizes = range(3, 10)

plt.plot(grid_sizes, [amh.to_check_pi(i).chatterjees_xi() for i in grid_sizes], label="CheckPi xi")
plt.plot(grid_sizes, [amh.to_check_min(i).chatterjees_xi() for i in grid_sizes], label="CheckMin xi")
plt.axhline(y=amh.chatterjees_xi(), color='r', linestyle='--', label="True xi")
plt.legend()
plt.grid()
plt.show()

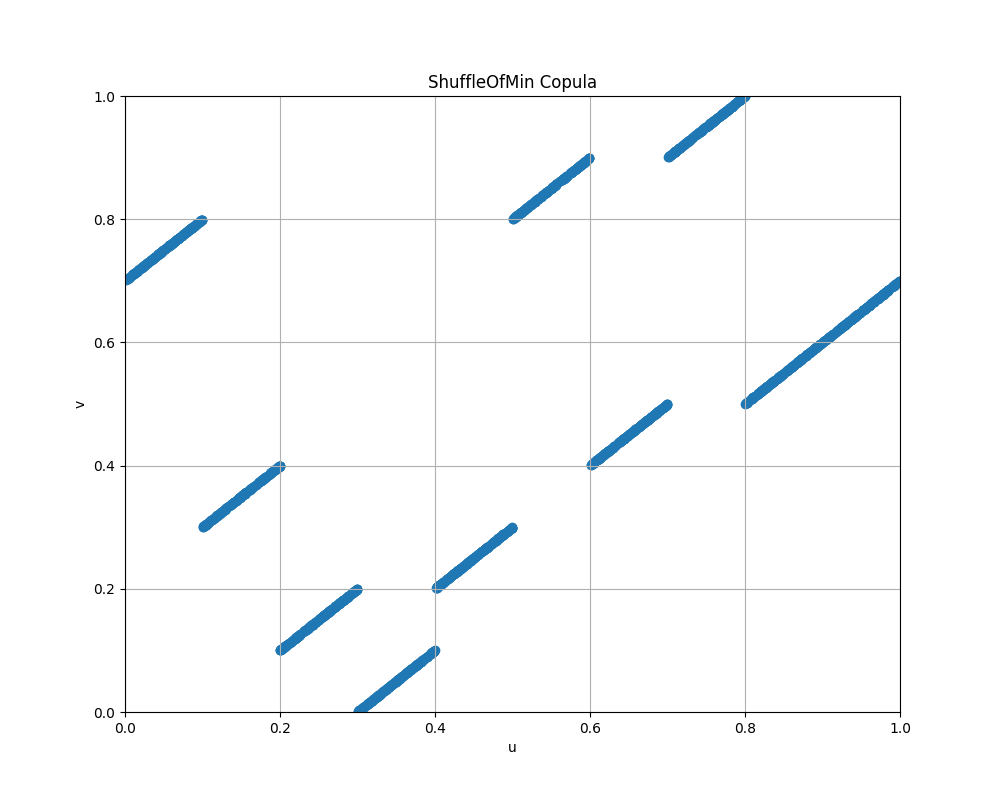
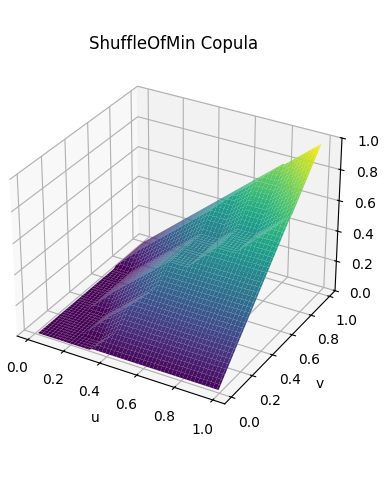
Shuffle-of-Min Copula
Visualize a shuffle-of-min copula defined by a permutation of the first 10 integers.
perm = (8, 4, 2, 1, 3, 9, 5, 10, 6, 7)
cp.ShuffleOfMin(perm).scatter_plot(2_000)
cp.ShuffleOfMin(perm).plot_cdf()